

The open-source Prometheus monitoring tool offers built-in instrument panel functionality, while Grafana is commonly used as the visualization layer for monitoring solutions. Both tools help teams handle and monitor logs, metrics, and time-series data stored in systems such as the Prometheus database.
Which tool you use depends on your monitoring requirements. Prometheus is strong at collecting, storing, querying, and alerting on metrics. Grafana is strong at building reusable dashboards, charts, and operational views across many data sources.
This article explains both solutions and how they compare when building an observability setup based on Prometheus technology.
What is Prometheus?
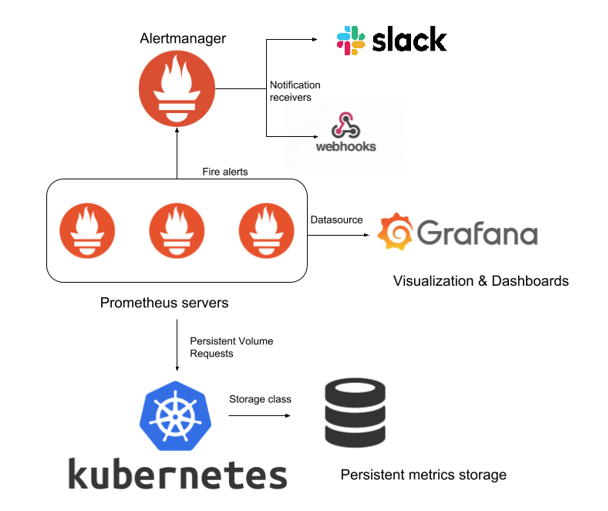
Prometheus is a system monitoring and alerting toolkit that many teams consider a standard choice for Kubernetes monitoring.
Prometheus gathers time-series data by pulling metrics from instrumented applications and infrastructure. It stores that data as queryable metrics and supports labels so teams can model dimensions such as service, endpoint, cluster, instance, and environment.
- Gather time-series data by pulling metrics from the codebase and infrastructure.
- Store data as metrics that can be queried later.
- Specify labels for multi-dimensional analysis.
- Build queries using time-series functions in PromQL.
- Generate and deliver threshold-based alerts through Alertmanager.
Prometheus native visualization
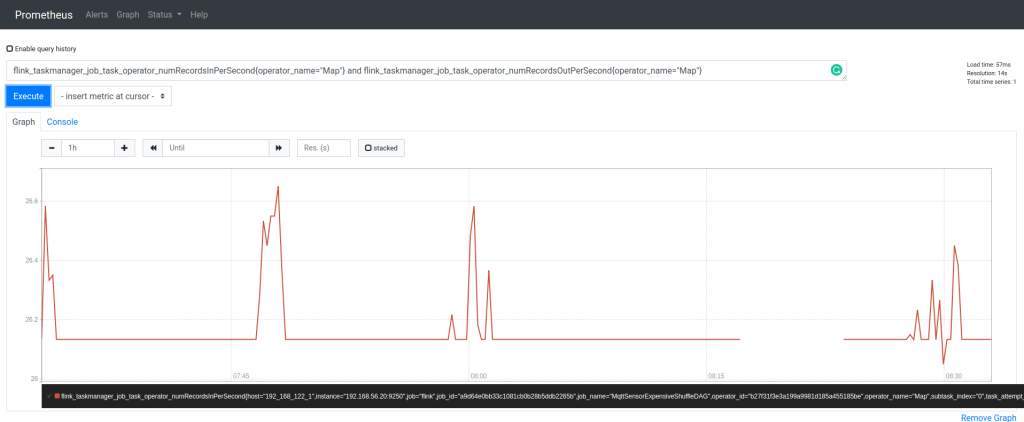
Prometheus includes a basic expression browser for visualizing metrics based on PromQL expressions. It is available through the /graph path of a Prometheus server installation.
The expression browser can show query results in tabular or graphical form, which is useful for live troubleshooting and quick metric inspection.
What is Grafana?
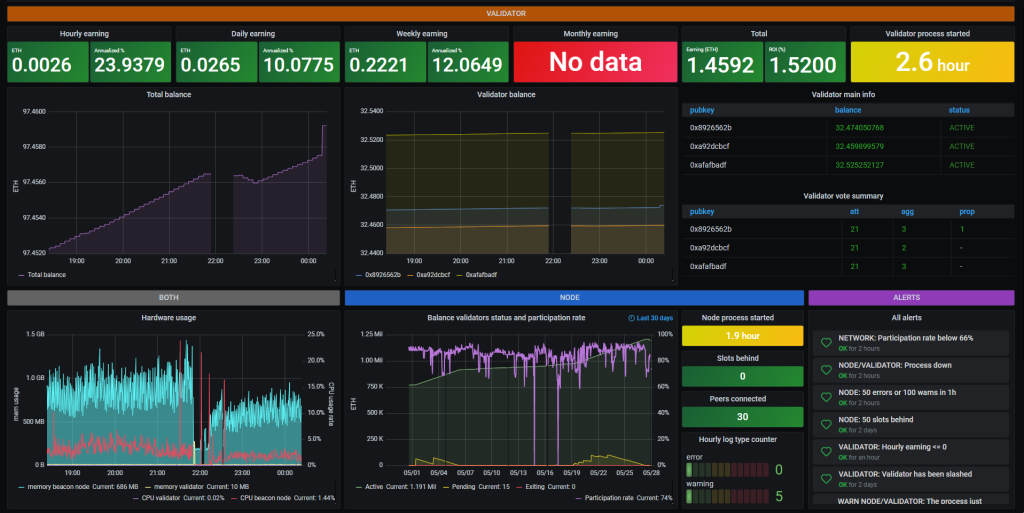
Grafana is a database analysis and monitoring tool that lets teams create dashboard visualizations for the key metrics they care about. It is widely used for reusable dashboards that can be shared across teams.
Because Grafana is open source and supports a large number of data sources, it is often used as a central visualization layer for metrics, logs, and operational data.
The most common Grafana use case is displaying time-series data, such as memory usage, CPU usage, request latency, error rates, and service availability over time.
- Create charts, graphs, and maps.
- Build and share dashboards.
- Configure alerting rules that query one or more data sources.
- Manage user access for teams and dashboards.
Monitoring-as-a-Service Solutions
Open-source monitoring stacks can be economical and cheaper to set up than paid solutions, but all factors should be considered. What you save in service cost may still appear as configuration hours, maintenance work, onboarding time, or performance limitations.
For some teams, a managed Monitoring-as-a-Service solution is worth considering because it reduces setup burden and gives access to support, onboarding, and feature enhancement paths.
- Setup and maintenance is easier.
- Feature enhancement requests are easier to raise.
- Monitoring tools can be centralized.
- Support and onboarding resources are available for the account.
Conclusion
Prometheus and Grafana both focus on observability problems, but they solve different parts of the workflow. Prometheus is usually responsible for collecting, storing, querying, and alerting on metrics. Grafana is commonly used as the visualization layer on top of Prometheus.
A simple Grafana and Prometheus setup is easy to run, maintain, and afford for many teams, but larger environments may require more planning around storage, retention, alert routing, permissions, governance, and operational support.
This blog is a simple learning-focused approach for understanding how visual graphs can help monitor data. Observability has strong practical value in analysis, operations, and performance monitoring.